
It’s that feeling that most of us have after we’ve put in a few solid training blocks in a row. The feeling of accomplishment, of fitness, of VICTORY. We just want to tell someone about our accomplishment! Do they KNOW how low this resting heart rate is?? Do they KNOW how hard this pace was for me to hit just months ago? For us runners, the high doesn’t stop on the run, it continues after the endorphin high has worn off, once we’ve downloaded our data, and are analyzing every bit of our training on our smartphones…
If this sounds like you, you are absolutely not alone. Part of the reason I think running has become so massively popular over the past 50 years, and continues to pick up in popularity, is because of the advent of accessible technology. It started with step counters in our cereal boxes as kids (maybe that ages me), and now it’s not even expensive to get a super solid GPS watch to track every metric on yourself from resting heart rate to sleep cycles!
While all this data is cool, it means nothing if you do nothing about the information.
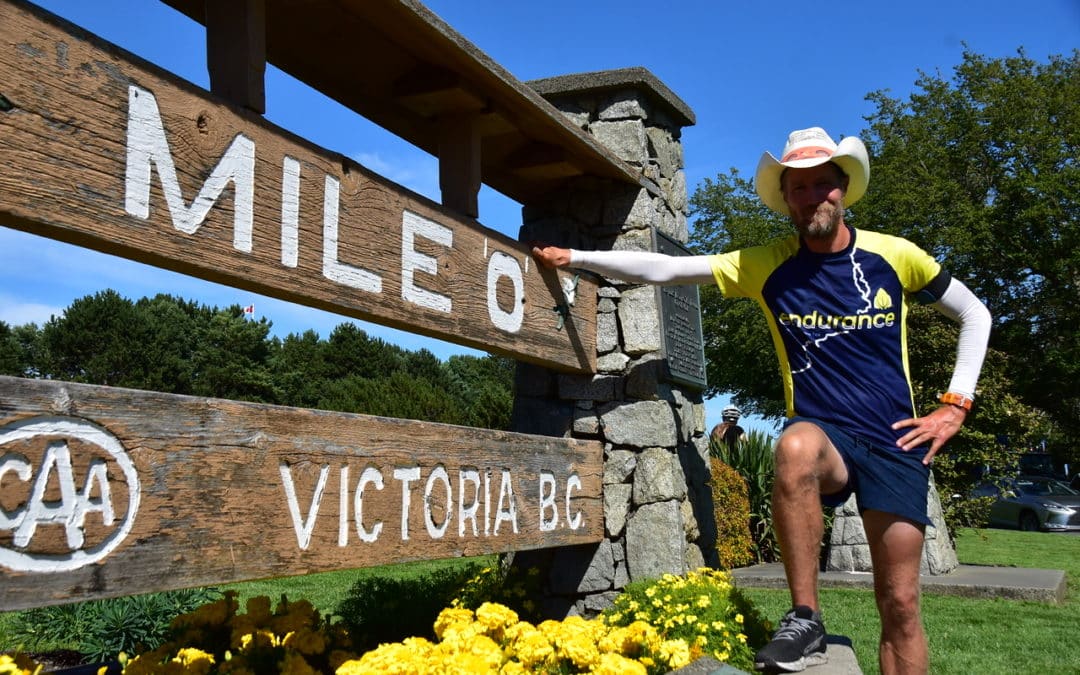
This past July (2022), Okotoks’ very own, Dave Proctor, crossed the finish line in Victoria, BC, completing a record-breaking run across Canada in 67 days and 10 hours.
He broke the previous record set by Al Howie, by 5 full days.
He had no rest days. He slept at night for 6–8 hours.
He ran for around 12 hours per day. Usually 105 kilometers per day.
He needed over 6700 calories per day just to stay at the same body weight.
Most people cannot comprehend this feat.
For this reason, we decided to look at the data to give us an idea of how hard and incredible this was. This blog is my attempt to make sense of all the data from Dave’s impressive trans Canada record in 2022, and to shed some light for you data nerds (like me) on what it took, physiologically. We will dive into the training blocks leading up to Dave’s impressive feat, check out his zones, paces, and heart rates, as well as go over some of the events that took place during the run that almost derailed him.
With Dave’s permission, we are combing through the data – let’s go!
After reading this blog, if you find yourself needing help with your training or performance, reach out to us at Vital Strength Physiology for FREE training advice HERE.
Quick Navigation
- What effect does training have on the body?
- What did his training look like leading up to the run?
- The 3 training blocks & physiological insights
- Events that almost ended Dave’s run
- Perspective
- Summary & Practical Applications
- References
What effect does training have on the body?
Training is a stressful stimulus on the body that the body reacts to with an increase in blood pressure, a decrease in force production, an increase in fatigue, or a depletion of muscle glycogen (the sugar storage we store in our body for energy).
The outcome of a training session can be long lasting if the training was stressful enough. Although immediately after a training session the system is fatigued, in some period of time (depending on the stimulus), there will be a training benefit, and a removal of that fatigue.
Cumulatively, after several sessions or phases of training that are stressful enough, the body adapts to said training.
Zatsiorsky and Kraemer found that the relationship between training and fatigue gains were in a 3:1 ratio… meaning that fatigue tends to be 3x shorter in duration (24h) than the training effect (72h). This is important for understanding how Dave made it across Canada.
To describe the effect that training has on the body, we use the term “supercompensation”.
This describes the period after the onset of fatigue that results in a physical adaptation that is above the previous baseline. If a new training stimulus is imposed before return to homeostasis again, the training results in continual increases in fitness (theoretically) Bompa & Haff (2019):

The idea of supercompensation is simply:
Do something hard.
Rest and recover.
If it is hard enough, you will adapt and get fitter.
If it was too hard, you are overtrained/injured and require additional rest (figures from Bompa & Haff, 2019):

This flow between creating disturbances in the body (distrupting baseline) and recovering from those disturbances (supercompensating), is how we reach new levels of fitness, and are able to run faster, recover faster, lift heavier weights over time, or have better health.
Training principles help us understand what type of training we should be doing in order to get these benefits over time, rather than plateau’ing in our training or even getting worse:
1) Training Overload: the body needs to acutely overload the volume or intensity of training to reach higher levels of fitness
2) Training Progression: in the medium to long term, we see progressions in fitness from the sum of the each session’s overload
3) Training Recovery: though breakdowns come acutely from pushing yourself, the training effect comes after a period of resting and recovering from training.
But what if you train, and break down, HARD, 67+ days in a row, as Dave did?
Well, that didn’t come without consequences. Spoiler alert: Dave ended Canada with a fractured foot; in an air cast.

We know that Dave is an absolute specimen who still wasn’t able to escape injury but WAS able to do something no man in recent history has been able to do. How did he get “there”?
What did his training look like leading up to the run?
If you’re training for a run across Canada, how much training should you do? That answer is probably different if you’re a full-time professional athlete compared to one of us Average Joes.
The problem for Dave is that he is not a full-time professional athlete, and he in fact has a very busy life juggling a girlfriend, 3 children, and a full time job as a massage therapist which is physically demanding. So, how much did he train for this world-record feat?

This is a training chart of Dave’s running volumes and intensities from January 2022 until the last day of his Run Across Canada (July 22, 2022).
What I want to point out before we dive deeper:
Light blue dots are the training intensity or pace relative to his threshold. A value of “1” is equal to Dave’s anaerobic threshold. So a value below 1 is a workout data point that is on average below threshold, and a workout data point that is above 1 is on average a strenuous one.
Red dots are the Training Stress Score (TSS) (or combination of volume and intensity; calculated value). By definition, a score of 100 is equal to one hour spent at functional threshold power (which is an estimate of the power you can sustain at anaerobic threshold). In January 2022, you’ll notice workouts around 100 TSS. By the end of the run across Canada, the training stress was around 1000 TSS per day.
Yellow shaded lines are the Training Stress Balance, AKA Form. Form stands for the balance between Fitness and Fatigue. “0” means equal fitness and fatigue so the athlete feels “neutral”: not too tired and not too tapered. A negative number means they are crushed. Typically, our app recommends us coaches not deliver more training per week than to elicit a -10 to -30 Form per week. You’ll notice Dave’s neared -400 during the start of the run.
The pink trendlines are the Acute Training Load AKA, Fatigue. Big increases are bad. You’ll notice that the pink lines typically mirror the yellow Form line, at least imperfectly. That’s because as you induce Fatigue, it will throw your balance out of whack… unless you have a lot of fitness to sort of “cushion that blow”.
Dark blue shaded trendlines are the trends in Chronic Training Load, AKA Fitness. As mentioned, increases are good and can buffer some of the negative effects of the Fatigue. The Fatigue represents the chronic volume and intensity of training you’ve accumulated over the last 42 days on a rolling average. Dave’s Fitness climbed a little during his first training block, a little quicker during his second training block, but nothing created Fitness like his run across Canada.
Using these training concepts, we can look at various ways that Dave’s training changed in the months leading up to his run across Canada. It’s easiest to break these up into Training Blocks.
.
.
The 3 training blocks & physiological insights
What do I mean by Training Blocks? Let’s break this down further:
- Accumulation Phase – January – Feb 2022
- Transmutation Phase – March – May 2022
- Run Across Canada – May – July 2022
If you’ve heard of periodization of training before, you might have heard of training blocks like accumulation, transmutation, and realization blocks. Simply put, periodization is the organization of training into smaller bite-sized pieces so that we can emphasize certain qualities, de-emphasize others, and attempt to create the best adaptations to the training we’re attempting to deliver, possible.
Vladimir Issurin is a researcher who in the last 10-15 years has published some interesting insights into how to lay out different structures of periodization for athletes to maximize their gains. For the purpose of Dave’s periodization, we will use block names from Issurin’s methodology.
.
- Accumulation Phase (a phase devoted to developing basic abilities, such as general aerobic endurance, muscle strength, general movement techniques)

This phase of training was marked from the start of January until the end of February, 2022 when Dave was training and increasing his volume moderately, but it was also the middle of winter in Calgary and Okotoks, so it wasn’t prime outdoor-running season.
This 9 week block of Dave’s training can be summarized in a few key points:
- This section of his training is called an accumulation phase because it was the first month that he started to accumulate some volume on his legs in a deliberate manner
- The weekly “mileage” averaged: 113km/week (range 46.3 to 193)
- The weekly Training Stress Score (TSS) averaged: 1161 (range 161 to 1419)
- The weekly Fatigue (ATL) averaged: 72 (range 26 to 199)
- The weekly Fitness (CTL) averaged: 82 (range 39 to 89)
- The weekly Form (TSB) averaged: -22 (range 21 to -61)
For those of you not too familiar with Training Peaks numbers, it might be more valuable to you if you just use it to compare it to the other sections of his training and the run across Canada (below)!
Some things to note:
- Notice how the dark blue shaded line begins to increase, which was an indication that his Fitness was slowly improving and building
- Notice the Training Intensity (paces) via the light blue dots, and how they hovered around 0.6-0.8. Since an intensity of 1 is equal to threshold pace, his average run was slow, below threshold, and easy
- Notice how many days Dave had zero Training Stress (red dot) meaning that he didn’t train on those days. You can compare that visually quite easily to the rest of the chart, and see how that compares to zero rest days while he was running across Canada.
02. Transmutation Phase (a phase devoted to developing more specific abilities like combined aerobic-anaerobic or anaerobic endurance, specialized muscle endurance, and proper event-specific technique)

This phase of training was approximately from the start of March to the end of May, 2022 when Dave was really ramping up his training volume and fitting these runs in between a full time job, 3 kids, and other commitments.
This 10 week block of Dave’s training can be summarized in a few key points:
- This section of his training is called a transmutation phase because it was the block before the event and it involved the most specific prep for the run
- The weekly “mileage” averaged: 163km/week (Range 35.8 to 238)
- The weekly Training Stress Score (TSS) averaged: 1760 (Range 368 to 2469)
- The weekly Fatigue (ATL) averaged: 246 (Range 98 to 353)
- The weekly Fitness (CTL) averaged: 177 (Range 102 to 227)
- The weekly Form (TSB) averaged: -70 (Range 82 to -150)
Some things to note:
- Notice how steady the Training intensity (light blue dots) have increased a lot from the previous training block. This is likely because long runs (he was often doing 40-100k training runs, sometimes multiple times per week) take a lot of TIME, something he didn’t have much of. So, in increasing the INTENSITY, he could bang out more training stress and finish the runs quicker to get about his day.
- His Intensity now hovered on average between 0.9 and 1.2. If you remember, an intensity of 1 is equal to your anaerobic threshold pace (something in theory that you could maintain for 30-60 minutes, and often called “tempo”). He was hitting a faster pace way more often in this block.
- Notice that his training Form was jagged at first but starting trending more positive (above zero) for the end of the block. This is a sign that he was getting so fit that he could run multiple 50km runs in a week and it wouldn’t be enough to improve his fitness at that time
- Notice how his Fatigue (pink line) starts to drop a lot before the run across Canada as he tapered, decreased the density of his workouts, and got ready for the volume and soul crushing run to begin.
03) Realization Phase (a phase designed as a pre-competitive or competitive training phase focused mainly on race modeling, obtaining sport-specific qualities and recovery prior to competition)

May 15, 2022 to July 22, 2022 when Dave was making his way from the East to the West coast of Canada.
This 11 week block of Dave’s training can be summarized in a few key points:
- This section of his training is called a realization phase, which by Issurin’s block periodization lingo, is worded to insinuate a racing or competition block. This differed from usual realization phases for other sports, that typically only peak for 1 week at a time, because Dave’s block was a crazy 67.5 days long
- The weekly “mileage” averaged: 655km/week (Range 154 to 752)
- The weekly Training Stress Score (TSS) averaged: 5571 (Range 1401 to 6836)
- The weekly Fatigue (ATL) averaged: 767 (Range 204 to 961)
- The weekly Fitness (CTL) averaged: 537 (Range 193 to 754)
- The weekly Form (TSB) averaged: -230 (Range 92 to -395)
Some things to note:
- Notice how steady the Training Intensity (light blue dots) and the total Training Stress Score (red dots) remained, despite changing environments and changing terrains during the run across Canada. Even on the days where Dave felt his best, he held himself back and maintained an average pace between 6:20 and 6:30min/km. His heart rate matched these paces throughout the run, and on average was only 129 beats/min!!!
- During the middle 50% of his run across Canada, his Form trended upwards. In other words, despite running approximately 105km/day, he is getting LESS crushed as his Fitness improved MORE than Fatigue was setting in. Or so it seemed.
- His training Form dips to around -400. Remember when we said Training Peaks recommends staying in the -10 to -30 range? This corresponds to the same range of his run that he started to feel his foot hurt.
- You’ll notice a spike in Training Stress Score and Intensity towards the end of the run. This isn’t because his heart rate was higher, or because his paces were slower, it’s something else. We’ll touch on that in the next section of this blog.
Some additional interesting pieces of his physiology, graphed:

Figure 1. Dave’s average daily pace during 105km of running per day across Canada.

Figure 2. Dave’s average elevation gain during 105km of running per day across Canada.

Figure 3. Dave’s daily average heart rate during 105km of running per day across Canada. Each point is the average heart rate across the entire day while his GPS watch was recording his activity.

Figure 4. Dave’s estimated calories burnt per day running 105km across Canada.

Figure 5. Dave’s daily distance (km) during his run across Canada.

Figure 6. The intensity factors (IF) during Dave’s run across Canada. An intensity factor of 1 corresponds to the athlete’s anaerobic threshold, and any efforts below this threshold are represented by a fraction of 1.

Figure 7. The efficiency factor (EF) during Dave’s run across Canada. The efficiency factor corresponds to the normalized graded pace to the heart rate. An increasing value for a given steady state aerobic effort can indicate improving aerobic fitness.
.
.
Events that almost ended Dave’s run
During the run across Canada, a few unforeseen circumstances arose. Though something like a musculoskeletal injury was beyond anyone’s doubt with that volume for that long, other things threatened to end Dave’s run at various points throughout.
After the run, Dave recalled 4 main events that almost ended his run across Canada, and one notable burst of energy in the middle:
.
.
- Respiratory virus from day 1 to day 11. This almost barely shows up on the data anywhere, but Dave said that it was one of the worst sicknesses he’s ever had. Though his volume of running dropped a little during these 11 days, and his calorie consumption decreased a little too, his paces were on target, and his heart rates remained low
.
. - Dave fell and got concussion day 40, 30km west of Thunder Bay. He struggled for the subsequent 2 weeks with sounds (the loud vibrational sounds from the highways) & was very irritable. Again, this was impossible to pick up from the data collected here, but may have been picked up if we were tracking RPE or HRV.
.
. - Dave’s foot started to become really painful around day 14. By the end of the run, he realized that the same pain that started around day 14 was a broken foot that needed to be casted for several weeks upon his return home.
.
. - Dave started to feel good Day 28 through 55 around Saskatchewan/Alberta border. This corresponds with July 8, when Dave entered the Province of Alberta at the end of the day. By this point, his paces were trending slightly faster (Figure 1), and his intensity factor was increasing also (Figure 6). These slight increases in pace, and inching of his intensity towards his threshold, along with the accumulated fatigue that we see in his Realization block graph, was enough to almost stop his run in its tracks. The mind is a powerful thing, and the motivation and excitement from being in his home province, seeing family and friends and familiar therapists, might have almost been his downfall, for the next block to come.
.
. - Day 55 to 68 felt very hard, and Dave wasn’t sure how he would continue across Canada. After getting through the middle of Canada, with his fitness improving, and his body breaking down, the excitement through Alberta almost broke him. He still had to make it through the Rockies, and over the Coquihalla summit, which he ended up completing, but the spike in his intensity (blue dots) and corresponding training stress (red dots) shows a clear spike during this time:
.
Perspective
After reviewing Dave’s data and talking to him from one friend to the other, one of the biggest things Dave learned from his 2018 Run Across Canada attempt to this current one, was that pace was the ultimate determining factor for this run.
In 2018, Dave had the backing of the Rare Disease Foundation, and millions of eyes on him from across the world, as many media outlets picked up the story, and increased the pressure around completing the run. Dave later told me that it was a combination of factors, but that he generally was taking the run too fast, and was too cocky, feeling like a superhero that was getting fitter each day.
This incredible fitness was actually measured by a Calgary doctor via MRI, who scanned the size of his heart pre-run, on Day 11, and after he de-trained. After only 11 days, Dave’s already massive heart (in comparison to the average male his age) had almost doubled in size. More on this can be seen at Dave’s Ted Talk in Calgary linked here:
We can also blame Dave’s fitness in the years leading up to this run, for his ability to actually break the world-record this time around. Some people might look at the 2 blocks of training leading up to this 2022 feat (shown. in this article) and think “Is that all it takes?”. Those blocks of training are hard, but are also volumes that most semi-elite endurance athletes can handle, no problem. By contrast, the actual run across Canada was something almost none of them would ever be able to finish in record time, so what’s the gap?
It’s hard to understate what growing up as a track athlete, and then working his way up to many ultra-endurance events throughout his 30’s did to build up to this event. Most people can’t keep their heart rates under 140bpm for a single aerobic “long slow distance run”, let alone AVERAGE heart rates for full 105km run’s DAY AFTER DAY FOR 67.5 DAYS! Figure 3 truly blows my mind. At the end of his attempt, he was averaging closer to a daily average heart rate of 120bpm for a full day of running. That aerobic fitness (marked by the ability of his massive heart to pump oxygenated blood and his venous network to deliver the oxygen to his hungry muscles) is out of this world.
Most people in the running community understand thresholds. Simply put, there are two main physiological thresholds that we physiologists like to use to mark various turn points in exercise, which help us prescribe training.
Training peaks uses intensity factor (IF), as mentioned previously, to calculate a given workout’s difficulty, by ranking it as a value compared to 1, being anaerobic threshold. Training Peaks suggests some typical IF values, pulled right from their site:
“Typical IF values for various training sessions or races are:
- Less than 0.75 recovery rides
- 0.75-0.85 endurance-paced training rides
- 0.85-0.95 tempo rides, aerobic and anaerobic interval workouts (work and rest periods combined), longer (>2.5 h) road races
- 0.95-1.05 lactate threshold intervals (*more commonly known as anaerobic threshold in exercise physiology spheres), shorter (<2.5 h) road races, criteriums, circuit races, longer (e.g., 40 km) TTs (time trials)
- 1.05-1.15 shorter (e.g., 15 km) TTs, track points race
- Greater than 1.15 prologue TT, track pursuit, track miss-and-out”
If you exercise at an intensity just past your anaerobic threshold, or IF=1, the effort/pace/power at and just past that point are going to be unsustainable after a relatively short period of time. The further past your anaerobic threshold you are, the sooner your body will force you to stop that intensity, or force you to decrease your power in order to continue exercising.
What’s amazing is that Dave maintained his intensity above 0.85 for the duration of the whole run across Canada. Instead of 0.85 being a “tempo” or long anaerobic interval ride, it was something he sustained for 11 hours per day, on average. Hell, he even snuck up close to being at an intensity closer to 0.95 for some of the weeks! For him, even intensities very close to his anaerobic threshold, he could keep them aerobic due to his ability to remove lactic acid through his aerobic muscle fibers.
Dave is such an aerobic machine that even “high threshold” work relative to his anaerobic threshold, kept him in aerobic heart rate zones, zone 1 paces (according to his predicted training zones), and sustainable, day-after-day efforts reflected in the data.
Though it’s past the scope of this piece, Dave’s mental strength (and the creation of his characters: the eagle, the coyote, the salamander, and the dragon, layered on top of his aerobic engine, paved the way for this world-record feat.
.
Summary & Practical Applications

How can you implement some of these components into your own training? Here are a few training take aways that I want you to know:
- Tracking things in your own training is a good first step. One of the questions I get asked the most often is “How long should I run for?” … “How many reps should I do?” … “What should my weekly mileage be?” … and so many iterations of that question. The truth is, I have no idea until I see what you’ve been doing/tracking for a while, and then I make some educated guesses. If you’re not already, start by tracking things.
This initial baseline, and the more training history we have on you, helps us make educated guesses on how to progress you, where your potential performance gaps could be, and what is required to take you to the next level of your goals.
. - Analyze your past injuries, history, and future goals. I believe this will give you somewhat of a blueprint of where you’ve been and where you’re going. A “gap analysis”, if you will. Two people with the same current training volume, but one who was a dancer and another who was a cross-country skier, will have different physiology, injury potential, and time lines for achieving their goals.
In the lead up to Dave’s run across Canada, we knew his feet would be an issue, because of his previous symptoms and injuries. Tightness in the arch, tibialis posterior, and calves, seemed to be something he was constantly getting treated, or that was jamming up when he increased volume. Though we were not able to prevent a break (the volume got the best of him), I do believe creating some resilience was key to his being able to complete the run.
In this step, we believe taking a detailed history and assessment is important, and is where we start off all of our clients.
- Hiring a coach is necessary when your knowledge and research has taken you far, but not the whole way. Googling is one way to get deep down some pretty interesting rabbit holes in training, but a good coach who has worked with someone like you, and has lots of specific knowledge about training for your event, is a good move. I wouldn’t hire me to fix your car – let’s put it that way.
. - You’re not the person the training plan on Google was written for. Similarly, if you just follow exactly what Dave did in his lead up to breaking the Canadian land-speed record, you probably won’t run it the same way Dave did. Sometimes we forget that in every other profession, we use individualized recommendations, so why wouldn’t we do that in our training? If you go to the dentist, they have to take x-rays and poke your teeth and gums with sharp objects before they create a treatment plan. If you take your car in for maintenance, they have special parts for the specific make, model, and year of your car, and the maintenance they do will also depend on what kind of a driver you are, too. Bald tires? Well it’s probably not a new engine they will recommend to get your car running more efficiently.
People forget that training plans printed from Google were not necessarily made for them. When they lose motivation to train, get injured, or completely fall off the bandwagon, they blame themselves, when really, I believe it’s because the training program wasn’t suited to them.
If we have 2 athletes who are the same age, with the same VO2max, and the same 5k time trials, should we just give them both the same training plans? Almost always, the answer is no, and I can’t stress how many times I’ve come across athletes on teams injured or unable to race for this exact problem.
Last, but not least, I wanted to write a quick shout out to Leah Kaluta, my intern at the time of the preparation and writing of this blog. Leah helped me sort through a lot of the Training Peaks files from the lead up and full cross-Canada run, and for her help I am thankful!
Want help with your training? Get us to review your current training and give you advice on how to optimize it. Hope you enjoyed this post & happy training!
References
Bompa, T. O., & Haff, G. G. (2019). Periodization Theory and Methodology of Training Fifth Edition (5th ed.).
Issurin. (2008). Block periodization versus traditional training theory: a review. In Journal of Sports Medicine and Physical Fitness (Vol. 48, Issue 1).
Issurin, V. B. (2009). Generalized training effects induced by athletic preparation A review. In Journal of Sports Medicine and Physical Fitness. https://doi.org/R40093065 [pii]
Issurin, V. B. (2010). New horizons for the methodology and physiology of training periodization. In Sports medicine (Auckland, N.Z.) (Vol. 40, Issue 3, pp. 189–206).
Zatsiorsky, V. M. (Vladimir M., Kraemer, W. J., & Fry, A. C. (n.d.). Science and practice of strength training.
Photo of Dave Proctor retrieved on October 12, 2022 from: https://impactmagazine.ca/features/athletes-with-impact/dave-proctor/
Intensity Factor, Training Peaks, retrieved on Nov 11, 2022 from: https://help.trainingpeaks.com/hc/en-us/articles/204071814-Intensity-Factor-IF-
Efficiency Factor, Training Peaks, retrieved on Nov 11, 2022 from: https://help.trainingpeaks.com/hc/en-us/articles/204071724-Aerobic-Decoupling-Pw-Hr-and-Pa-HR-and-Efficiency-Factor-EF-